Writing your own SQL reports with the Query Analyzer
Your own SQL, displayed as an ordinary Pulse Dashboard report: sortable, filterable, printable and exportable like any other. New to Pulse Dashboard? Start with the fundamentals.
Every so often the number you need is on no report, and no arrangement of columns will produce it. That is what the Query Analyzer is for. It runs whatever SQL you write and hands the result to the grid as an ordinary report. The query can read your Macola® tables, Pulse Dashboard's own optimized tables or any other SQL database.
It is one of the three report types on the Designer module, so that module has to be licensed. Since version 5.66, editing one requires Admin mode, because the report runs whatever SQL it is given. A user without Admin mode can still run the report, read its query and copy it out. Admin-Only Edit Settings covers what changed.
Adding the report and writing its query
Add a new report to any tab and choose Query Analyzer from the Designer module. The box has two parts: a SQL editor at the top and the result grid below it. Type or paste a query into the editor, then refresh the box to run it. The same query can be edited in the report's settings (the red wrench icon), and whether the editor shows on the report at all is itself a setting.
Since version 5.66 the editor is the one used everywhere else in the product, with syntax coloring and IntelliSense that completes table, view and column names from your own database.
The box takes a query typed straight into it, and for a quick change that is
fine. A query worth developing deserves the Advanced Query Analyzer
instead: Administration → Tools → Query Analyzer..., in the same Admin
mode you already need to edit the report. It is a full query tool built the
way SQL Server Management Studio works: queries run in the background where
you can cancel them, GO batches and multiple result sets work, scripts open
and save as files, and the Optimized Table
Explorer is on its Query menu. Both tools run
on the application's own database connection, so a query that works in the
analyzer runs unchanged on the report. Develop the query there; paste it into
the report to deploy it. The Advanced Query
Analyzer
release note covers the tool in full.
Column names do more work here than on a standard report. A square-bracket
alias becomes the column heading, so as [Test Date] is the whole job of
labeling a column. Name a column exactly as a Pulse field instead, such as
cus_no, pulse_inv_amt or ord_dt, and the grid goes further: it adopts
Pulse Dashboard's own caption and display format for that field.
Start from an existing report
You rarely need to write a query from nothing. Since version 5.66, every report grid in Pulse Dashboard will show you the SQL that produced it. Right-click the grid and choose View SQL Query.
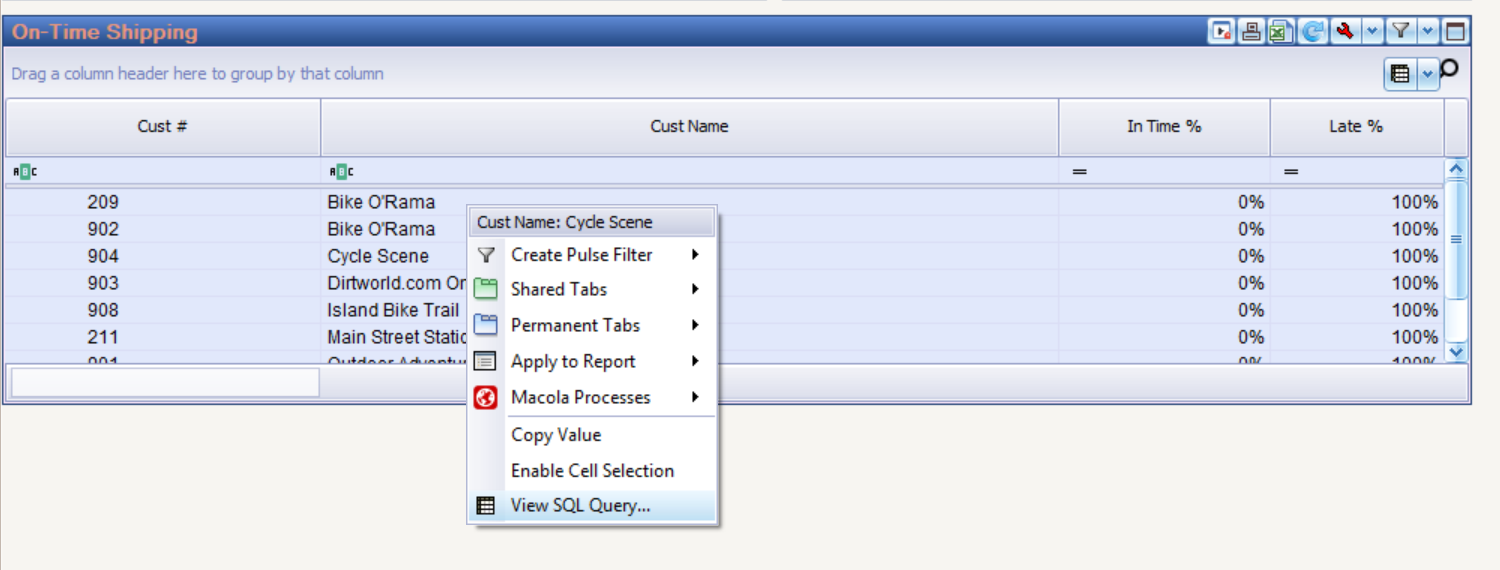
The SQL Query window shows the query that actually ran, with its filters, parameters and date ranges in place. Copy it out, paste it into a Query Analyzer box and refresh, and you have the same rows the original report showed, now yours to trim, join and extend. In Admin mode, that window will open the query in the Query Analyzer for you. View SQL Query covers where it works and who can use it.
Querying the optimized tables
Pulse Dashboard does not read your Macola® tables directly every time a report
refreshes. It first gathers what the reports on screen need into purpose-built
optimized tables, such as #OPT_CustomerOrdersYear, #OPT_ARAging and
#OPT_InventoryStatus. Your own query can read them too, and they are the
tables to reach for before any raw Macola® file, for what has already been
done to the data on its way in.
The joining has been done. The tables are flat: one row of the sales dataset
(#OPT_CustomerOrdersYear) carries the customer, the salesperson, the item
and the item location alongside the order line, with amounts sign-corrected
and converted for unit of measure, so what takes a half-dozen joins against
the raw files is a plain select here:
select cus_no, cus_name, doc_no, doc_dt, pulse_total_amt
from #OPT_ARAging
So has arithmetic that exists in no Macola® table. #OPT_MRP_Details carries
the netted numbers from the MRP regeneration: every supply-and-demand row
shows the projected on-hand balance after that event. #OPT_InventoryStatus
carries usage, inventory turns and months of supply over rolling windows. Each
table has its own set of calculated columns like these, and they are usually
the numbers a custom report is wanted for in the first place.
Seeing what is in there is the job of the Optimized Table Explorer: Query → Optimized Table Explorer (Ctrl+Shift+O) in the Advanced Query Analyzer. It lists every table with the columns each can carry and the Macola® field behind each column, and its description pane says what a calculated column is derived from. Searching for a column name finds the table it lives in, and Insert SELECT writes a starter query against it. The editors' IntelliSense completes the same tables and columns as you type. On paper, the Optimized tables reference describes every table: what a single row represents, how far back it reaches and which standard reports read it.
When a query names an optimized table, the box builds that table first, with
the columns the query asks for. It finds those by reading the column names out
of your query, so name the columns you need rather than writing select *,
which names none of them.
The quickest route to a finished report uses all of this at once. Take the query behind a report that is nearly right with View SQL Query, open the Explorer to see what else its optimized table can carry, extend the query in the Advanced Query Analyzer until it returns the rows you want, and paste it into a Query Analyzer report. You are starting from numbers Pulse Dashboard has already worked out, instead of rebuilding them from the raw files.
Filtering dates on the report
A real date column gives the grid three ways to filter it, from quickest to most precise.
On Macola® Progression, a date is a number first
Progression stores nearly every date as an int holding yyyymmdd, so a
column selected straight from a Progression table formats as a number and
none of these filters appear on it. One expression in the query turns it
into a real date: Writing SQL for Macola® Progression
has it, along with the padded-text trap that comes with the same tables. On
Macola® ES and Macola 10 the dates are already dates.
The auto-filter row is the blank line under the column headings. Type in it and the report narrows as you type.
The header filter appears when you hover over a column heading, as a small funnel at its right edge. Click it and check the dates you want.
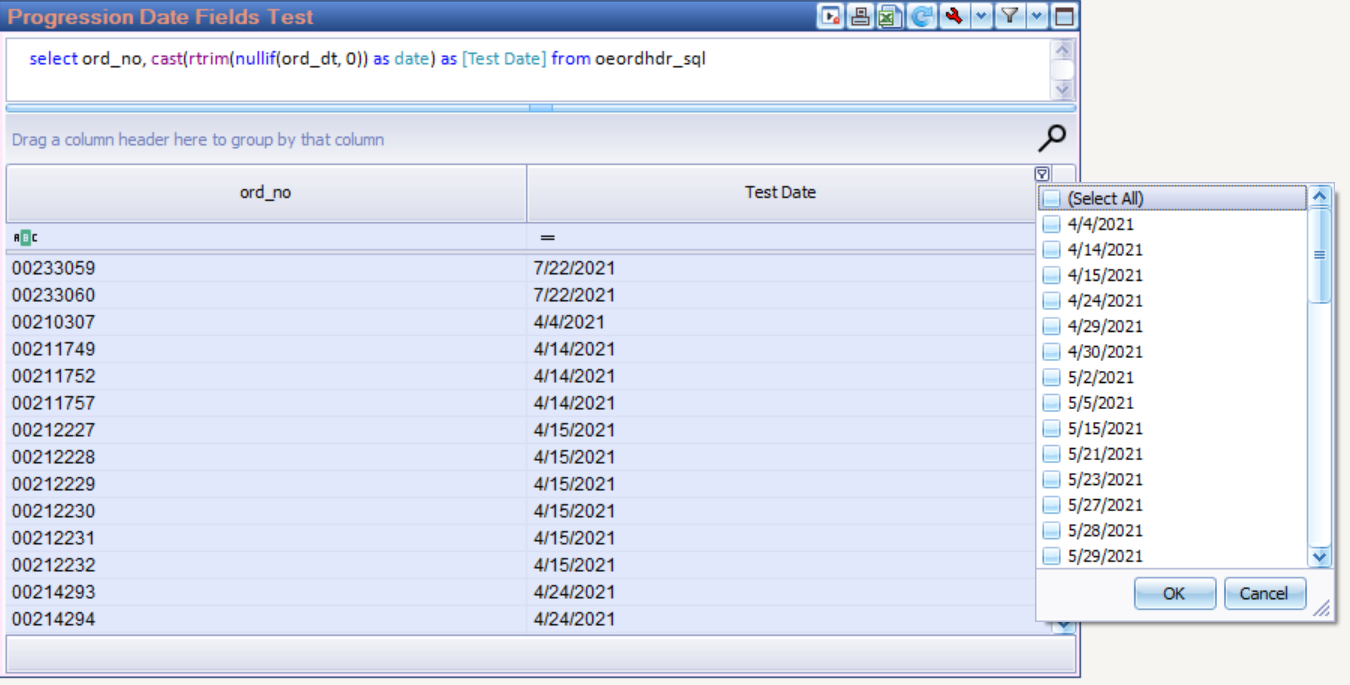
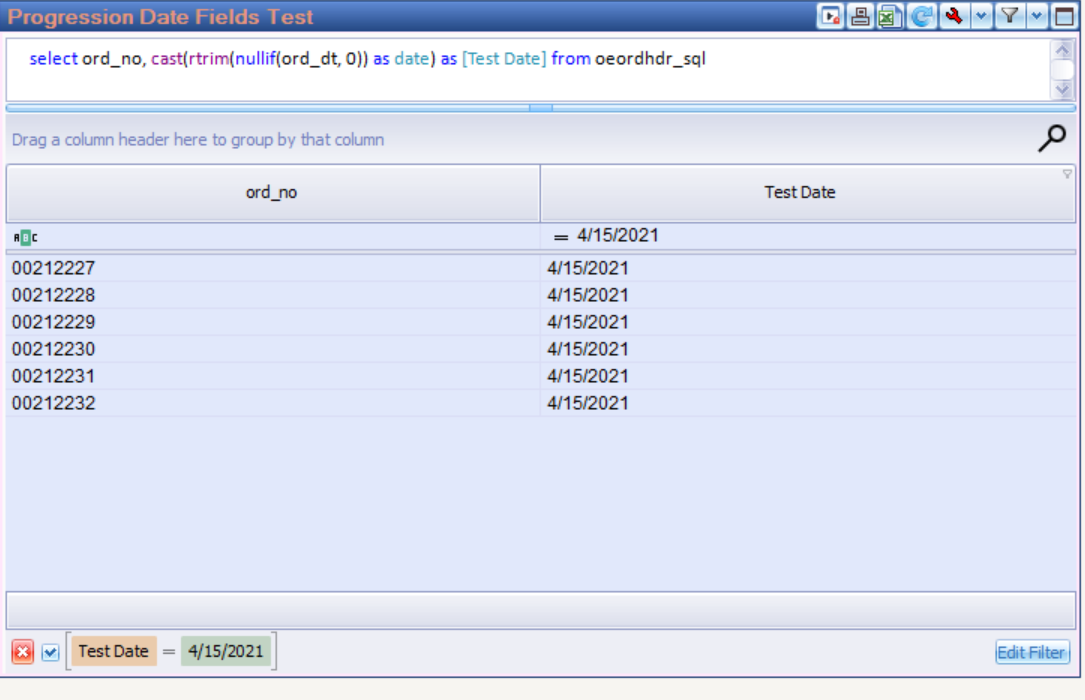
Checking a day filters the whole of that day. The grid writes it as on-or-after that date and before the next one, so it still behaves where a column carries a time as well as a date.
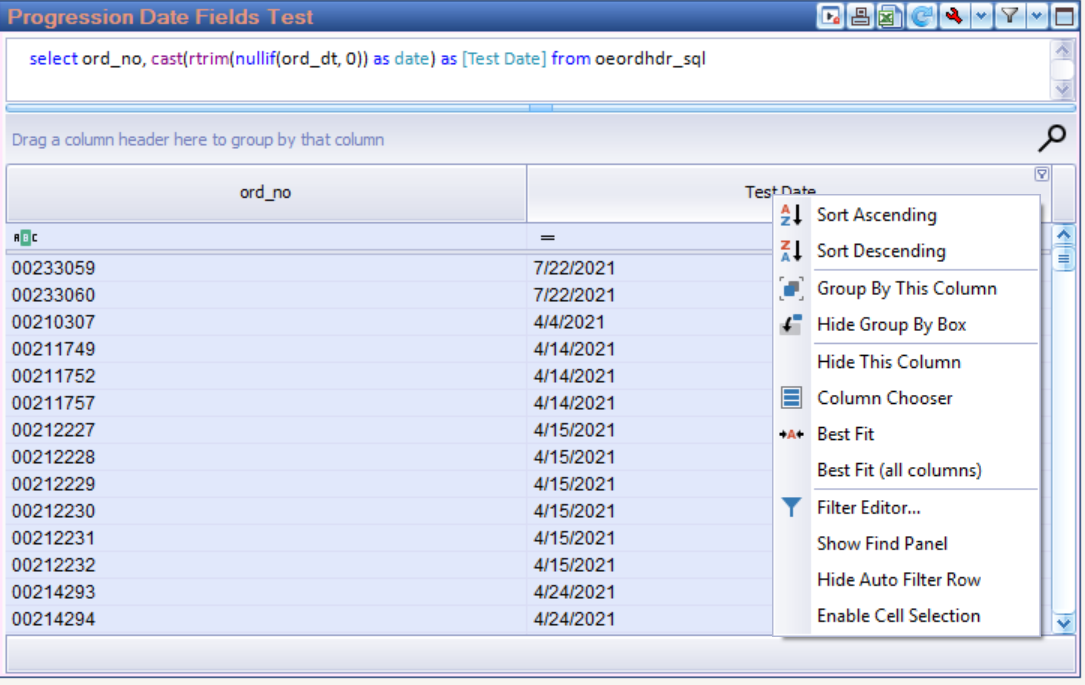
The Filter Editor builds any condition you like, and combinations of them. Right-click the column heading and choose Filter Editor....
The editor gives one condition per row: the column, an operator and a value. A new condition starts as Equals.
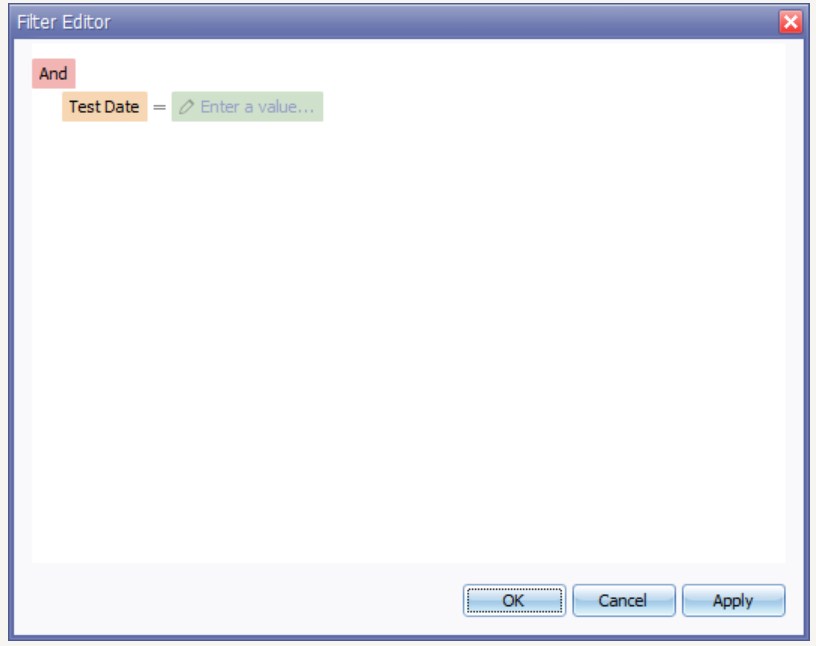
The = sign between the column and the value is a button, and this is the part
most people never find. Click it and the full range of operators opens.
Because the column is a real date, that list runs a long way past equals and
greater-than.
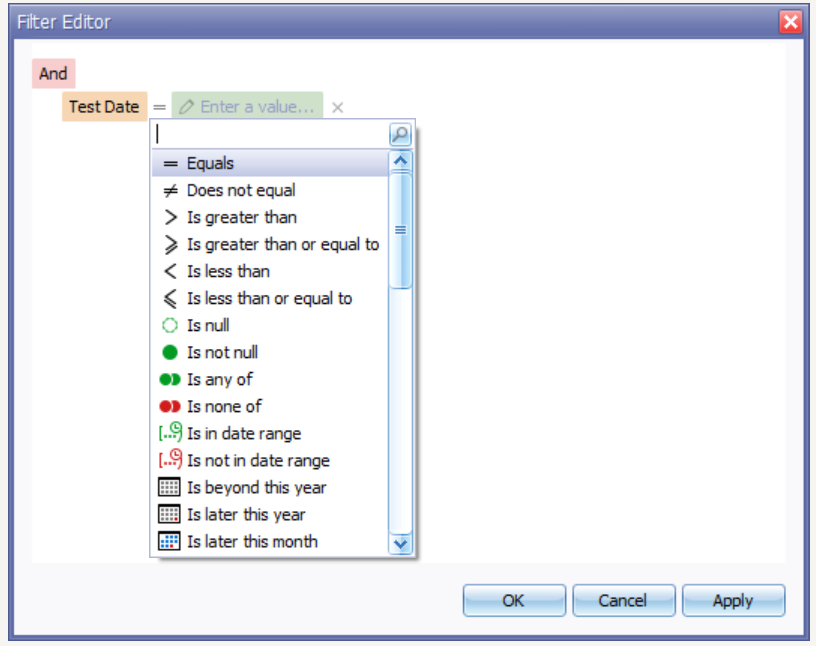
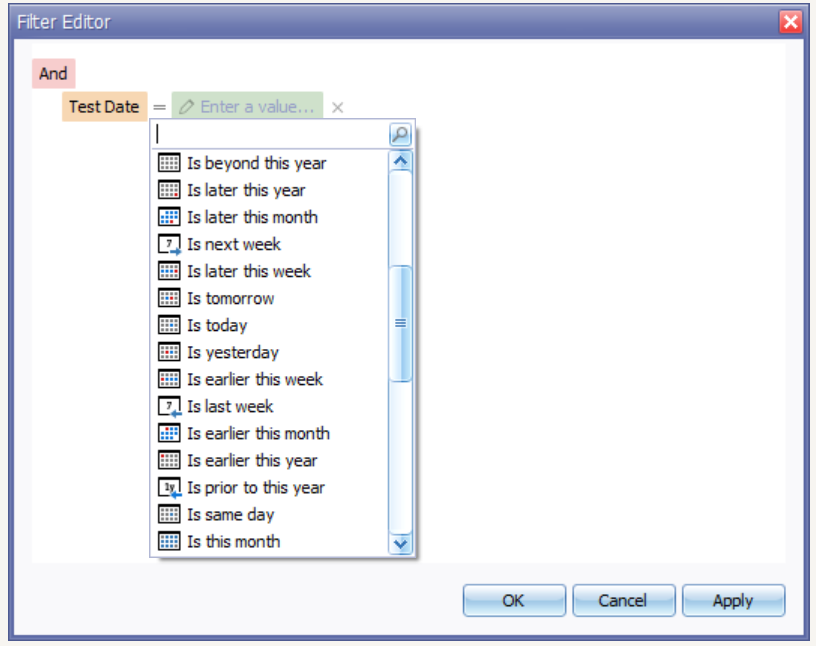
Apply runs the filter with the editor still open, OK applies it and closes, and Cancel closes without keeping your changes.
What the date operators do
Comparing against a date you enter:
| Operator | Keeps rows where the date... |
|---|---|
| Equals / Does not equal | is exactly the entered date, or is anything but |
| Is greater than / Is greater than or equal to | falls after the entered date, or on it |
| Is less than / Is less than or equal to | falls before the entered date, or on it |
| Is same day | falls on the same calendar day, whatever the time of day |
| Is in date range / Is not in date range | falls inside the two dates you enter, or outside them |
| Is any of / Is none of | matches one of several dates you pick, or none of them |
Testing for a blank date:
| Operator | Keeps rows where the date... |
|---|---|
| Is null | is blank |
| Is not null | is present |
Is null is usually the fastest way to spot orders that never had a date keyed at all.
Comparing against today, with no value to enter and nothing to keep up to date as the calendar moves:
| Operator | Keeps rows where the date... |
|---|---|
| Is today / Is yesterday / Is tomorrow | falls on that calendar day |
| Is this week / Is last week / Is next week | falls in that calendar week |
| Is earlier this week / Is later this week | falls in this week, before yesterday or after tomorrow |
| Is this month / Is last month / Is next month | falls in that calendar month |
| Is earlier this month / Is later this month | falls in this month, before this week or after this week |
| Is this year / Is last year / Is next year | falls in that calendar year |
| Is earlier this year / Is later this year | falls in this year, before this month or after this month |
| Is prior to this year / Is beyond this year | falls before January 1 of this year, or after December 31 of this year |
| Is the year-to-date period | falls between January 1 of this year and today |
Twelve more operators, Is January through Is December, keep the rows falling in that month of any year.
The relative operators follow the workstation clock
Is today, Is this year and the rest of the relative operators compare
against the calendar date on the PC, not against the Pulse Dashboard date
selector. The two differ whenever somebody has moved the Pulse date to
report on a closed period. To make the query itself follow the Pulse date,
use @PULSEUSERDATE in the SQL.
All three kinds of filter narrow the rows the query already returned. None of
them changes the SQL that runs, so a query that takes a minute to come back
takes that minute whether a filter is on it or not. To cut the work at the
source, put the condition in the WHERE clause. @PULSEUSERDATE is worth knowing
there: Pulse Dashboard replaces it, anywhere it appears in the query, with the
date in the selector at the top left of the screen, so
where doc_dt <= @PULSEUSERDATE follows the Pulse date instead of a hard-coded
one.
Formatting columns
A Query Analyzer report has no Column Chooser, so a column's format comes from the query itself.
From the column name
The grid reads each column's name and caption and applies a format when it recognizes a pattern:
| The name or caption | Formatted as | Displays as |
|---|---|---|
contains Qty or Quantity |
quantity | 1,234.50 |
contains $ or Amt |
currency | $1,234.50 |
contains % or Pct |
percentage | 12.34% |
ends in _dt, or contains Dt |
date | 07/22/21 |
The grid applies the rules in that order and the last match wins, so a column
called Freight $ Qty formats as currency rather than as a quantity.
Percentages have one trap worth knowing before you use them: the format multiplies by 100 on the way to the screen. The column should carry 0.1234 for a figure you want to read as 12.34%. A query that has already done the multiplication will display 1234.00%.
From a format token
Where the automatic choice is wrong, or a column needs particular decimal places, put the format in braces at the end of the alias. The token sets the format and is stripped from the heading:
select count(*)         as [Vendors{n0}],
       sum(total_amt)   as [Open Amount{c0}],
       max(ord_dt)      as [Ordered{MM/dd/yyyy}]
{n0} to {n2} are plain numerics, {c0} to {c2} currency and {p0} to
{p2} percentages, with the digit setting the decimal places. They are the
same codes the Column Chooser takes on a standard report, and Everyday
tips lists them. A date pattern such as {MM/dd/yyyy}, or a full
.NET format string such as {#,##0.000}, works the same way.
Grouped column headings
Since version 5.66, a Query Analyzer report can put its columns under shared
band headings. This is what makes a wide report readable when its columns
repeat in blocks, one block per vendor, per month or per location. Name the
alias Group::Column and every column sharing that prefix sits under one band:
select v1.vend_name  as [Vendor 1::Vendor],
       v1.unit_price as [Vendor 1::Price],
       v2.vend_name  as [Vendor 2::Vendor],
       v2.unit_price as [Vendor 2::Price]
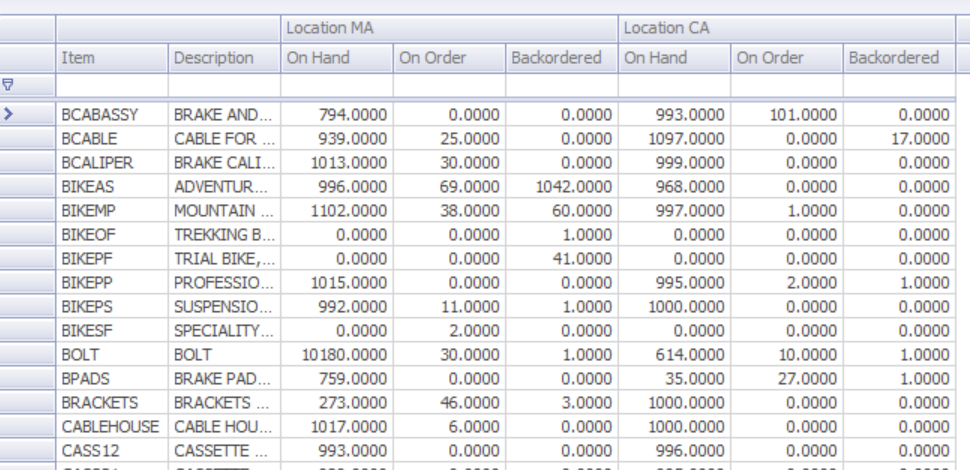
A second separator nests one band inside another, the format tokens above work
alongside the grouping, and a query with no :: in it is drawn exactly as it
always was. Grouped Column
Headings has
the rest, including how the name-based formats read a band name.
Running a stored procedure
The query does not have to be a select. A Query Analyzer box will run a
stored procedure, or a script beginning with declare, and display whatever
result set comes back:
exec dbo.LeahyOpenOrdersByBuyer
For anything several people run, the stored procedure is usually the better choice. Change the procedure once on the server and every user picks it up on their next refresh, with nothing to re-share. It also keeps a long query out of the report settings, and lets your database administrator grant it exactly the permissions it needs and no more.
One setting stands in the way: Enable advanced dashboard integration must
be off before a stored procedure will run, and off before an ORDER BY clause
will work. Sort on the grid instead, where a saved sort survives refreshes.
Passing Pulse filters into the query
A Query Analyzer report can follow the tab's Pulse filters, either automatically or by naming the fields you want.
Automatically, with advanced dashboard integration
With Enable advanced dashboard integration turned on, Pulse Dashboard wraps
your query and appends the tab's current filter selections as a WHERE clause,
covering every column of your result whose name matches a Pulse field. Filter
the tab to one customer, and a query returning a cus_no column narrows to
that customer on its own. The price is the two restrictions above: no
ORDER BY inside your query, and no stored procedures.
Explicitly, with the @@ placeholders
Wherever one of these tokens appears in the query, Pulse Dashboard substitutes the tab's current filter value for that field, in quotes:
| Placeholder | Carries the filter value for |
|---|---|
@@CUS_NO |
Customer number |
@@ITEM_NO |
Item number |
@@ITEM_LOC |
Item location |
@@AP_VEND_NO |
Vendor number |
@@OE_ORD_NO |
Customer order number |
@@PO_ORD_NO |
Purchase order number |
@@PP_ORD_NO |
Production (POP) order number |
@@SF_ORD_NO |
Shop floor order number |
@@INV_NO |
Invoice number |
Because each token becomes a quoted literal, it also works as a stored procedure argument. That is how a procedure receives the tab's filters:
exec dbo.LeahyCustomerDetail @@CUS_NO, @@ITEM_NO
@PULSEUSERDATE belongs to the same family, and carries the Pulse date
selector into a select statement's WHERE clause. It is an expression rather
than a quoted value, so use it in a select, not as a procedure argument.
The report's settings
Edit Settings on the box, the red wrench icon, requires Admin mode. Besides the query itself, it holds:
| Setting | What it does |
|---|---|
| Show Query Editor in Pulse Report | Shows or hides the SQL editor strip above the grid. Hide it once a report is finished and the box is all results |
| Auto-fit columns to match Box width? | On, columns squeeze to fit the box. Off, they keep their widths and the grid scrolls sideways, which is the right choice for a wide report |
| Enable advanced dashboard integration | Applies the tab's Pulse filters to the query automatically |
| Hide Group by Panel | Hides the "drag a column header here" strip above the grid |
| Hide Footer Panel | Hides the summary footer below it |
| Use Advanced Group Panel | Turns on linked detail panels, defined with Define |
| Turn on Odd / Even Row Color | Bands the rows, in the default color or one you choose |
Linked detail panels
A Query Analyzer report can carry its own drill-down. Use Advanced Group Panel, then Define, attaches up to two detail panels to the main query, and up to two more beneath each of those. Each panel is a query of its own, with a panel name, a list of linking columns on the parent side and the matching list on the child side, a grid or card presentation and its own back color. Where a link needs several columns, separate them with semicolons. Rows in the main grid then carry an expander, and opening one shows the child rows whose link columns match.
The linked queries all run when the report refreshes, so a panel opens instantly rather than going back to the database. Remove Linked Columns hides the join columns from the child grid, where they only repeat what the parent row already shows.
There is more to set up here than anywhere else in the report, and the column lists have to match on both sides, spelling and case included. If you are building your first one, call us and we will go through it with you. It is usually quicker than working it out from the dialog.
Where to go next
- Advanced techniques — clean-slate reports, custom formula columns and the rest of the Designer toolbox
- Writing SQL for Macola® Progression — Progression only: real dates out of its numeric ones, and the padded text columns that silently break a join
- Optimized tables — the reference for every table Pulse Dashboard builds for its reports
- Advanced Query Analyzer — the 5.66 editor, its IntelliSense and the Optimized Table Explorer
- Everyday tips — format codes, tab colors and the right-click habits
- How Pulse Dashboard works — why your own SQL still behaves like a standard report
Need a hand?
The PULSE support team is happy to help — call (513) 723-8095 or email [email protected]. If a report is giving you a figure you cannot account for, send us the query behind it: right-click the grid, choose View SQL Query and copy it out.