View SQL Query
Right-click any report grid and choose View SQL Query to see the SQL that produced the rows on screen. From there you can copy the query out, or open it in the Query Analyzer.
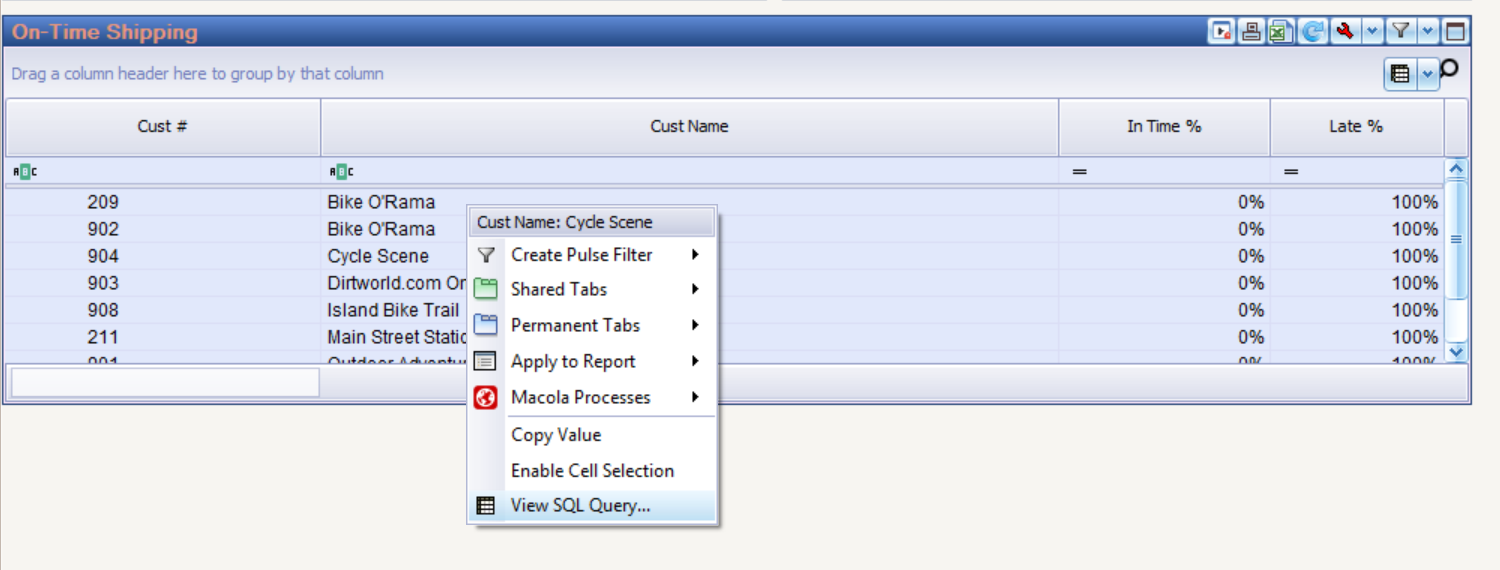
The query you are shown is the one that actually ran, captured as PULSE Dashboard executed it. It is not rebuilt afterward from the report definition, so the filters, parameters and date ranges in it are the ones that produced the rows in front of you.
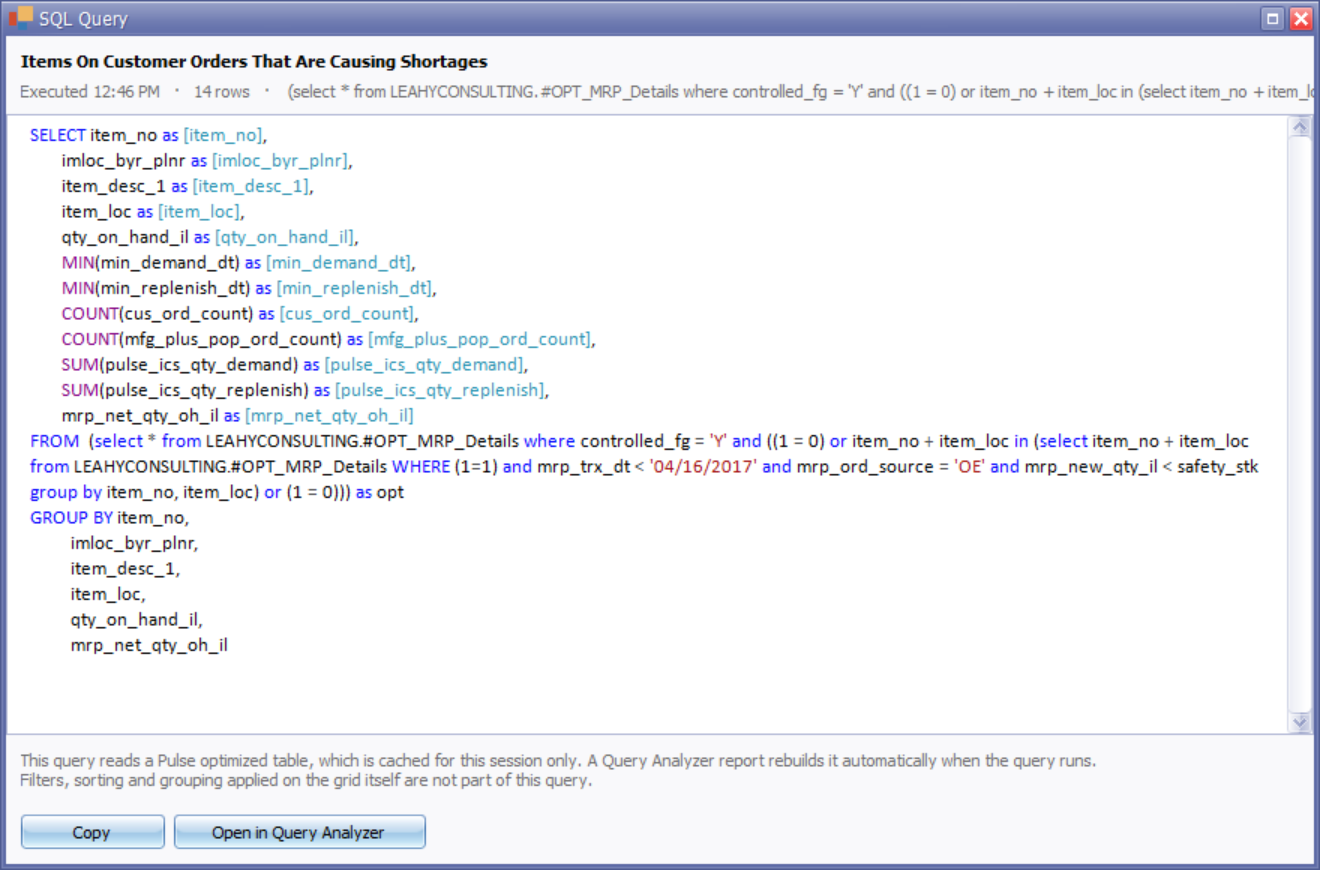
The heading names the report, when the query ran and how many rows came back. Where the report reads one of PULSE Dashboard's optimized tables, the window says so, and notes that filtering, sorting and grouping applied on the grid itself are not part of the query.
Where it works
- The main grid on a reporting box
- Both levels of a drilldown
- The Details grid in presentation mode
Who can use it
View SQL Query is available to every user. Open in Query Analyzer is admin-only, because the Query Analyzer runs raw SQL against your database.
When a number looks wrong
Copying the query and sending it to us is the fastest way to settle whether a figure is coming from the data or from the report. Call the PULSE support team on (513) 723-8095 or email [email protected].