Advanced Query Analyzer
The Advanced Query Analyzer has been rebuilt around the way SQL Server Management Studio works. It now completes object names from your own schema, opens and saves script files, runs queries in the background where you can cancel them, and shows you where the query is running and how long it has been going.
IntelliSense
Every suggestion carries an icon for the kind of object it is, and the characters you have typed so far are shown in bold, so the reason an entry is on the list is visible at a glance. A caption beside the list names the object type and the fully qualified name.
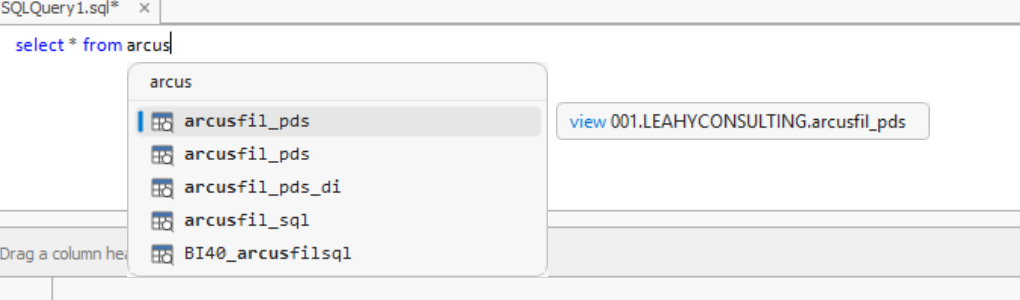
Schema names are offered after FROM. Typing schema. narrows the list to that schema, and schema.table. completes that table's columns. Bracketed names and table aliases are both understood.
Opening and saving scripts
The File menu works: New Query (Ctrl+N), Open (Ctrl+O), Save (Ctrl+S) and Save As. Those items were on the menu in earlier releases but did nothing when clicked.
Each tab remembers the file it came from and shows a marker while it has unsaved changes.
Running a query
Execute is F5 and Cancel Executing Query is Alt+Break, matching the shortcuts you already use in SQL Server Management Studio. Queries run in the background, so the window stays responsive while one is running, and Cancel stops the query straight away instead of waiting for it to finish on its own.
GO batch separators are honored. Batches run in order on the same connection, so a #temp table created in one batch is still there in the next. When SQL Server reports an error, the line number points at the line of your script rather than at the line within the batch.
A script that returns more than one result set keeps all of them. A Results: picker on the toolbar switches between them.
The toolbar is grouped the way SSMS groups its own, and its icons are drawn as vectors so they stay sharp on a high-resolution display.
Row limit
Results are capped at 500,000 rows by default, so a SELECT against a large table cannot exhaust the workstation's memory before you have a chance to stop it. Set the limit under Query → Row Limit.
Status bar
The status bar along the bottom shows the server and database the query is running against, an elapsed clock that runs while the query runs, and the number of rows returned.
PULSE Dashboard's optimized tables
PULSE Dashboard builds its optimized tables in tempdb under internal names. SQL Server's own schema views cannot see them, which is why they never used to appear in completion.
They now appear in completion like any other table. Columns that are not yet in the table are still offered, drawn muted so you can tell them apart.
Query → Optimized Table Explorer (Ctrl+Shift+O) browses the same tables in a window of its own — what each one holds, every column it can carry, and the Macola® field behind each column. See Optimized Table Explorer.
A query is read before it runs
Accepting a muted completion used to produce Invalid column name, because the column was not in the table that had been built. The analyzer now reads the query before it runs it and builds each optimized table the query names with the columns the query selects, so a query against #OPT_ARAging runs against a table that has the columns you asked for.
The same editor on the Query Analyzer report
The Query Analyzer report has three places where SQL can be edited: the editor on the report itself, the editor in its settings screen, and the editor in the group-panel designer that holds the main and drilldown queries. All three were plain text boxes, so the same query looked different depending on which screen you opened it from. All three now use the editor described on this page, with syntax coloring and IntelliSense.
For a user without edit rights, the editor on the report is read-only rather than disabled. A disabled editor could not be scrolled or selected either, so a user in that position could neither read a long query nor copy it.
A long query holds up the rest of PULSE Dashboard
Queries run on the application's own database connection. That is what lets them see the temporary tables PULSE Dashboard has already built, and it is a deliberate trade: while a long query runs, the rest of PULSE Dashboard's database access waits for it. Press Alt+Break to cancel the query and release the connection.
Getting started
No setup is required — everything on this page is available after the upgrade. Edit Settings on the Query Analyzer now requires Admin mode; see Admin-Only Edit Settings.