Dashboard Explorer
Settings → Dashboard Explorer shows the whole dashboard as one tree: the core modules, the report tabs inside each module, and the reports on each tab. It is the fastest way to see how a dashboard is put together, and to get to any part of it, without clicking through it tab by tab.
It opens in a window of its own, and can be docked to either side of the dashboard instead.
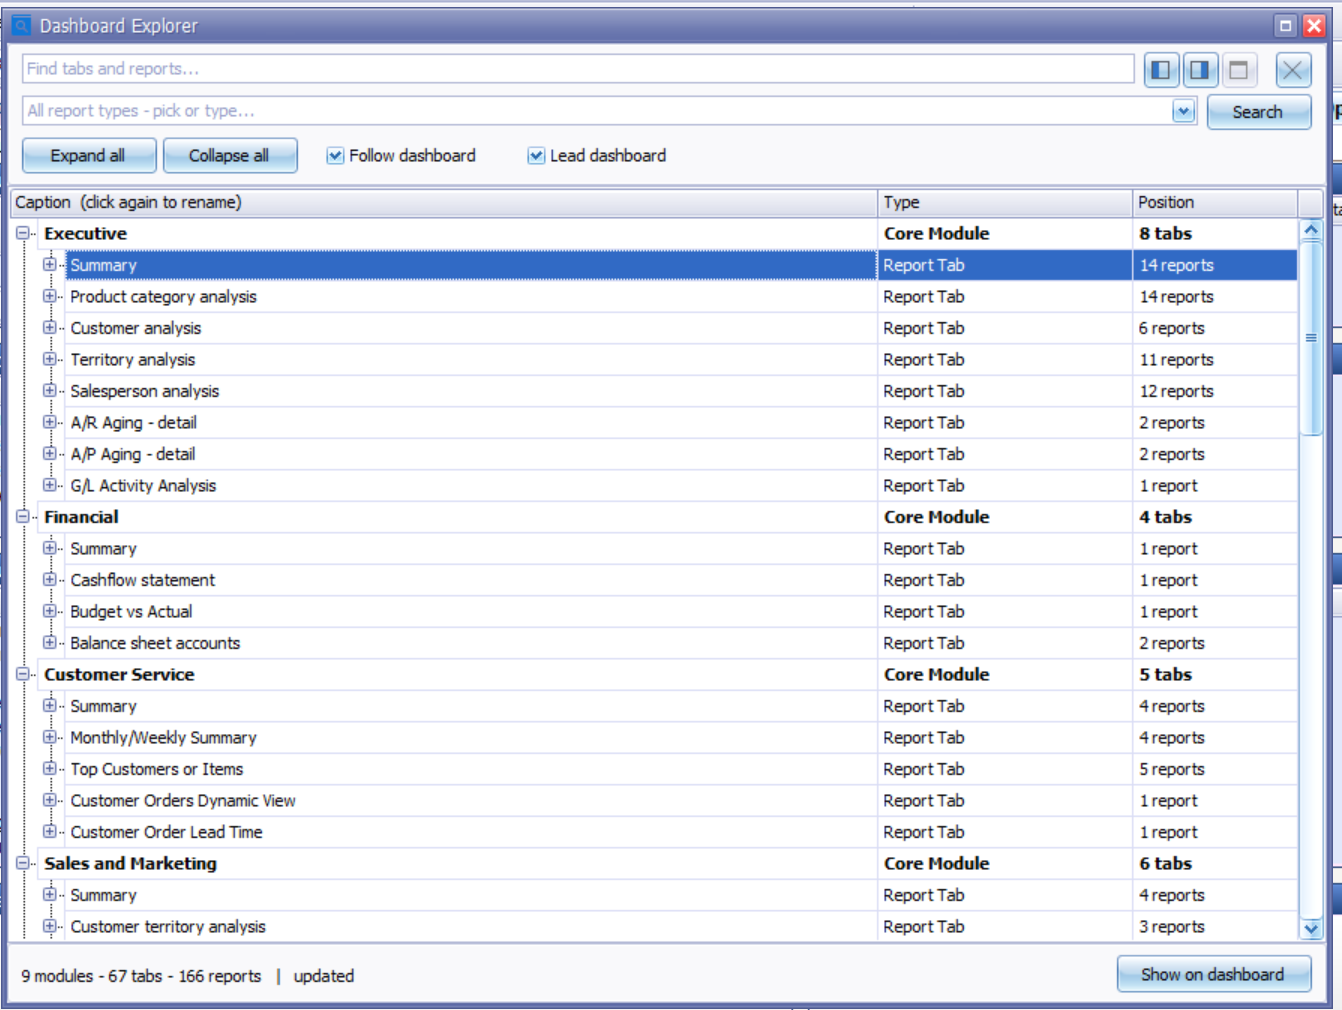
The three columns
Each entry lists three things, all shown by default:
- Caption — the name as it appears on the dashboard. Click it a second time to rename it.
- Type — Core Module, Report Tab, or the report type as it appears on the Add New Report menu.
- Position — what the entry contains: how many tabs a module holds, how many reports a tab holds.
Any column can be dragged off the header to hide it, and brought back from Column Chooser on the header's right-click menu. Which columns you have hidden is remembered per user, which is worth knowing when the Explorer is docked and there is less width to go around.
Finding and going to a report
Type into Find tabs and reports... to narrow the tree to matching entries. Reports can also be filtered by type, which is the quickest way to pull out every graph or every grid across all your modules at once.
Double-click a report, press Enter on any entry, or click Show on dashboard to go to it. Expand all and Collapse all open and close the whole tree.
Following and leading
Two switches keep the tree and the dashboard in step, in either direction.
- Follow dashboard keeps the list synchronized with the dashboard. Selecting a tab or a report on the dashboard highlights the matching entry in the tree. It is on by default.
- Lead dashboard does the reverse. Moving to an entry in the tree opens it on the dashboard, so you can browse with the arrow keys without moving focus out of the list. It is off by default.
Renaming reports and tabs
Click a caption a second time to rename it in place. The dashboard behind the Explorer picks the change up immediately, so you can check the result without closing the window and reopening the tab.
Renaming here changes the same setting the report's own settings screen changes, so nothing needs migrating.
Docking it beside the dashboard
The three buttons in the Explorer's header dock it to the left of the dashboard, dock it to the right, or float it again. Docked, it stays open while you work, and the splitter between it and the dashboard sets its width.
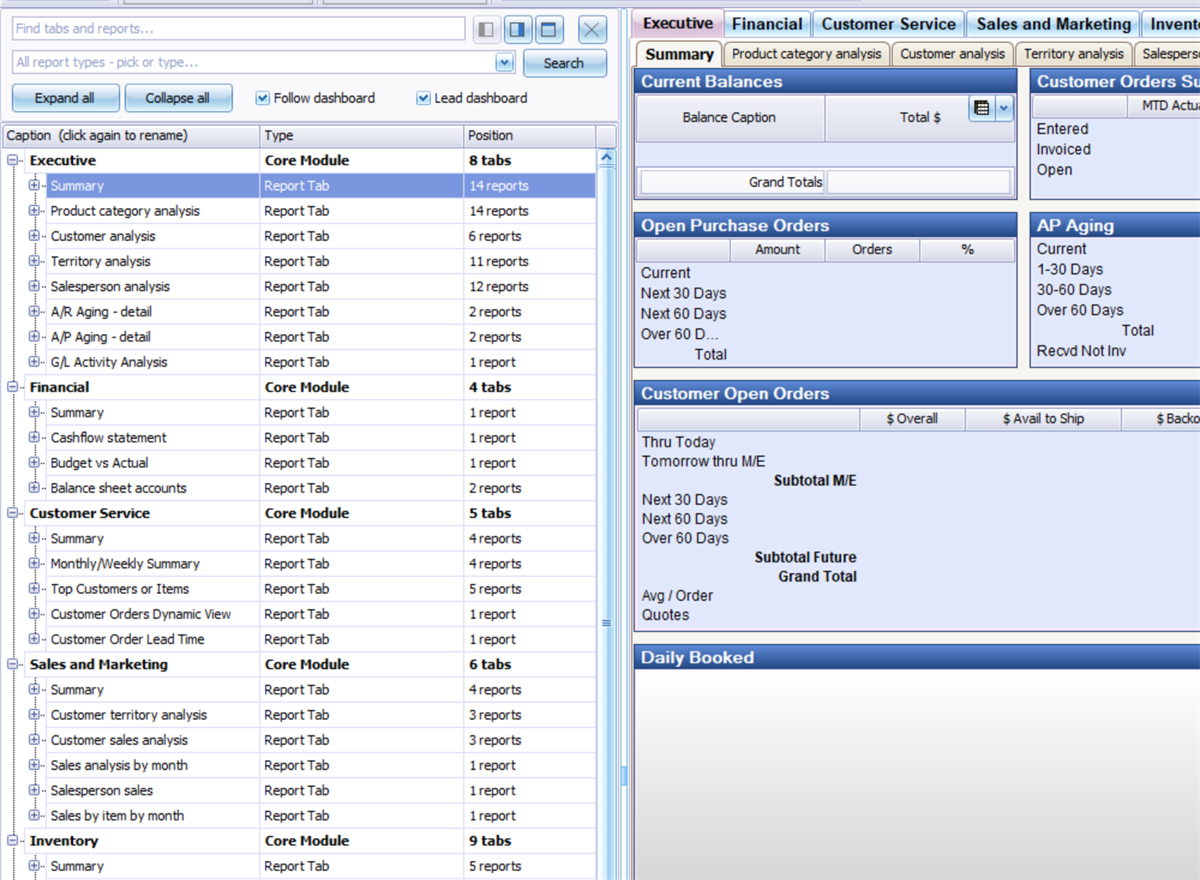
Where you left it is remembered per user, along with the width of each side and which columns you have hidden. A docked strip comes back the next time PULSE Dashboard starts; a floating window does not.
Getting started
Dashboard Explorer appears on the Settings menu after the upgrade, with nothing to configure. Your position, dock side, column choices and both switches are saved as you change them.